Server Timing with Rico
#Java
#Rico
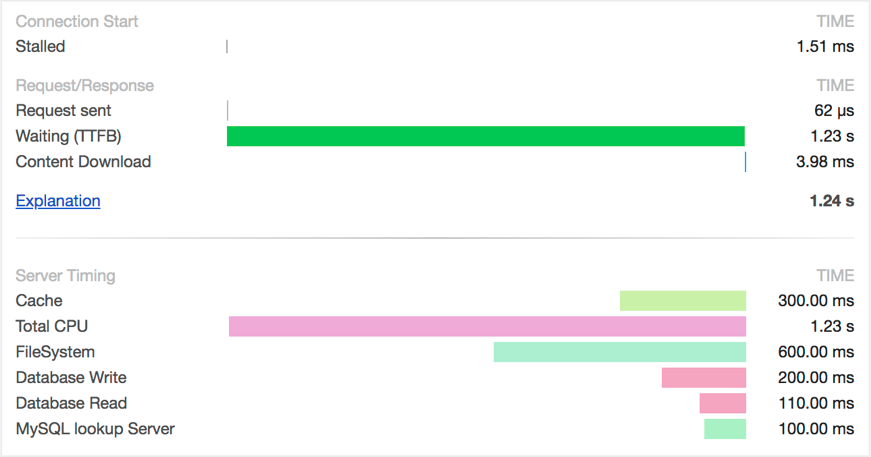
In our open source project Rico we introduced the support of "server timing" for JavaEE and Spring. Server Timing is a new W3C feature that allows you to add some metrics about the request handling to the response. I already introduced server timing in [one of my last posts]({% post_url 2019-01-09-integration-docker %}). The following image shows how such information would be rendered in the developer console of chrome:

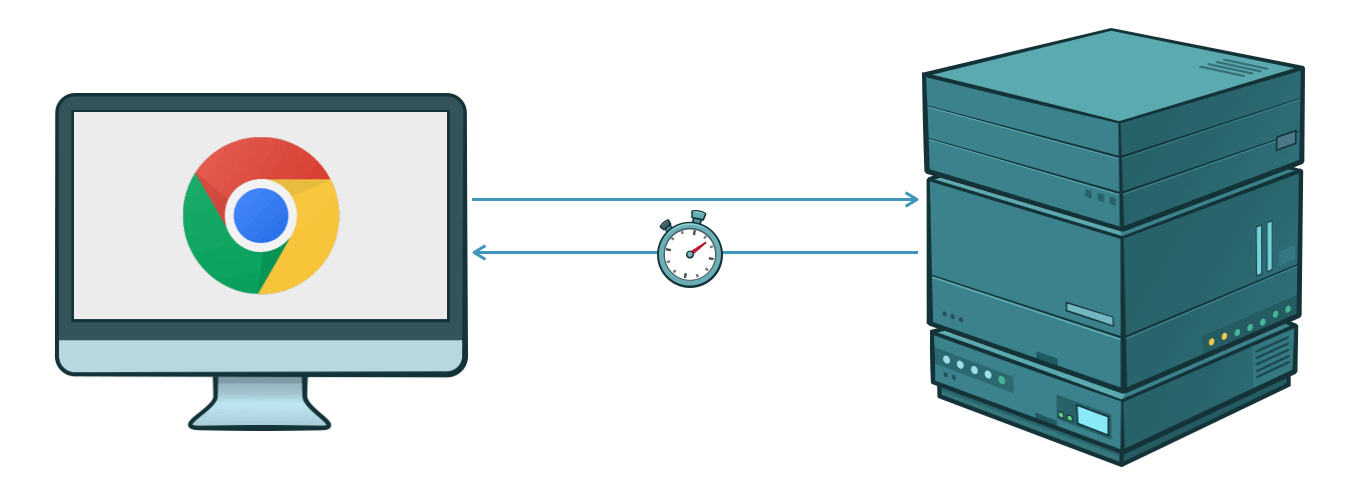
The feature is very useful when you develop a client that uses HTTP calls to communicate with the server. In this case, the client sends an HTTP request to the server and receives an HTTP response after some time. The functionality that the server executes to create the response based on the request is a black box for the client. Normally this is not really a problem but let's think about a possible bottleneck on the server. Sometimes your HTTP call takes much longer than normal. To make it worse the problem only happens when you do not debug the server. In such case "server timing" is a really helpful feature since you can display some timing information about the server functionality in the client.
Using Server Timing with Rico
Rico provides a managed component that can easily be injected in any Spring or JavaEE bean. This component is defined by the dev.rico.server.timing.ServerTiming interface and lives in the request scope. By injection the component you can easily create metrics in your server that will automatically be added to the HTTP response. Here the w3c specification for server timing is used. Such dev.rico.server.timing.ServerTiming instance can be used to create metrics. A metric is defined by the dev.rico.server.timing.Metric interface and can be used to automatically add timing information to an HTTP response. The following code snippet shows the basic usage of the API:
final Metric dbMetric = timing.start("DB-Operation");
//Do some work on the database
dbMetric.stop();
The given sample creates a metric with the given name "DB-Operation" and will automatically record the duration until the stop() method of the metric is called. If this happens during an HTTP call you can see the duration of the "DB-Operation" directly in the developer console of your chrome browser.
Let's have a look how you can use this feature is a simple REST endpoint in JavaEE. The following code shows how timing metrics will be created for a REST endpoint:
public class MyEndpoint {

    @Inject
    private ServerTiming timing;

    @Inject
    private Database dabase;

    @GET
    public void clearAllData() {
        final Metric metric1 = timing.start("delete-users", "Deletes all users in the DB");
        database.deleteAllUsers();
        metric1.stop();

        final Metric metric2 = timing.start("delete-items", "Deletes all items in the DB");
        database.deleteAllItems();
        metric2.stop();
    }
}
Before we discuss this sample let's have a look at the same endpoint in Spring:
public class MyEndpoint {

  @Autowired
  private ServerTiming timing;

  @Autowired
  private Database dabase;

  @RequestMapping("/api/delete")
  public void clearAllData() {
        final Metric metric1 = timing.start("delete-users", "Deletes all users in the DB");
        database.deleteAllUsers();
        metric1.stop();

        final Metric metric2 = timing.start("delete-items", "Deletes all items in the DB");
        database.deleteAllItems();
        metric2.stop();
    }
}
As you can see the use of the Rico API is 100% the same in JavaEE and Spring. This is one of the big benefits of Rico that offers all its services and components as managed beans for JavaEE and Spring. In the example, an endpoint is defined that does 2 calls against a database. For both of this calls a dev.rico.server.timing.Metric instance is created to measure the duration of the calls. Since the "server timing" specification supports a description next to a name for a timing entry, Rico allows to create metrics with a name and an optional description. In the given sample both metrics are defined with a description. Once a client calls the endpoint the htpp response will automatically contain the timing information and you can see the duration for the "deleteAllUsers" and the duration for the "deleteAllItems" step directly in your browser.
Better integration in enterprise frameworks
The given example is just the beginning and with the next Rico release metrics to create "server timing" records can easily be defined by an annotation. This feature will first be available for JavaEE but will be added for Spring in the near future. Instead of injecting a dev.rico.server.timing.ServerTiming instance and create metrics by hand you can add the dev.rico.server.timing.Timing annotation to each method of a managed bean that duration you want to record. The following code shows how you can easily record the duration of an HTTP endpoint by doing so:
public class MyEndpoint {

    @GET
    @Timing("item-count-metric")
    public int getItemCount() {
        final int count = ... // do some calculations;
        return count;
    }
}
Like the basic API the Timing annotation supports of a name and a description for a metric.

Since you do not want to send metrics with every request to the client we currently add some configuration properties to Rico that let you configure when metrics should be added to a response. By doing so you can easily activate metrics in case of an issue when you want to have a look at the server timing information.